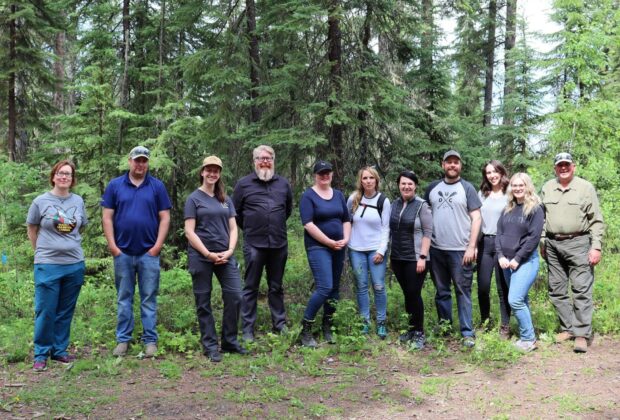
It’s 2019 and a Ducks Unlimited Canada (DUC) team is in the Yukon completing a mapping project in partnership with Tr’ondëk Hwëch’in First Nation that will provide knowledge-sharing opportunities and eventually inform wetland conservation policy and progress.
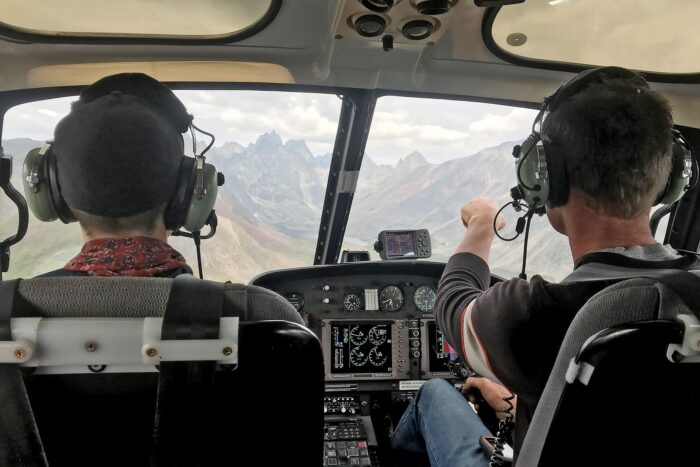
From a helicopter, the group of conservationists and scientists hovers above the mysterious landscape below. A collage of mountains and valleys, permafrost and stunted northern forests, wetlands and uplands sprawls beneath them as they lean against the fishbowl windows to identify various natural features.
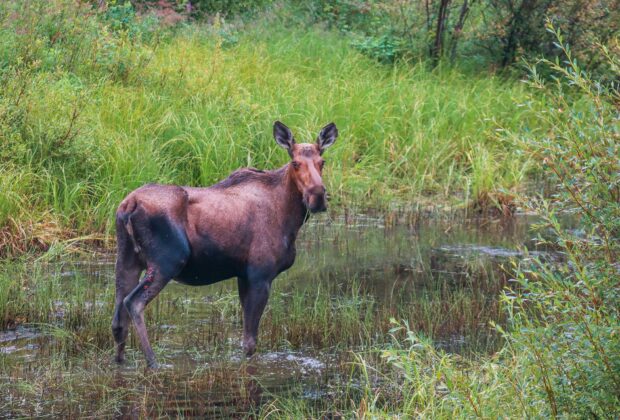
“Black spruce,” the caller relays into the headset. “Bog birch, maybe some sedge too, can we get a little closer?” A recorder marks down the sightings and waits while the helicopter pilot lowers the team to a new altitude as a startled moose trots off. “Moose,” relays the caller.
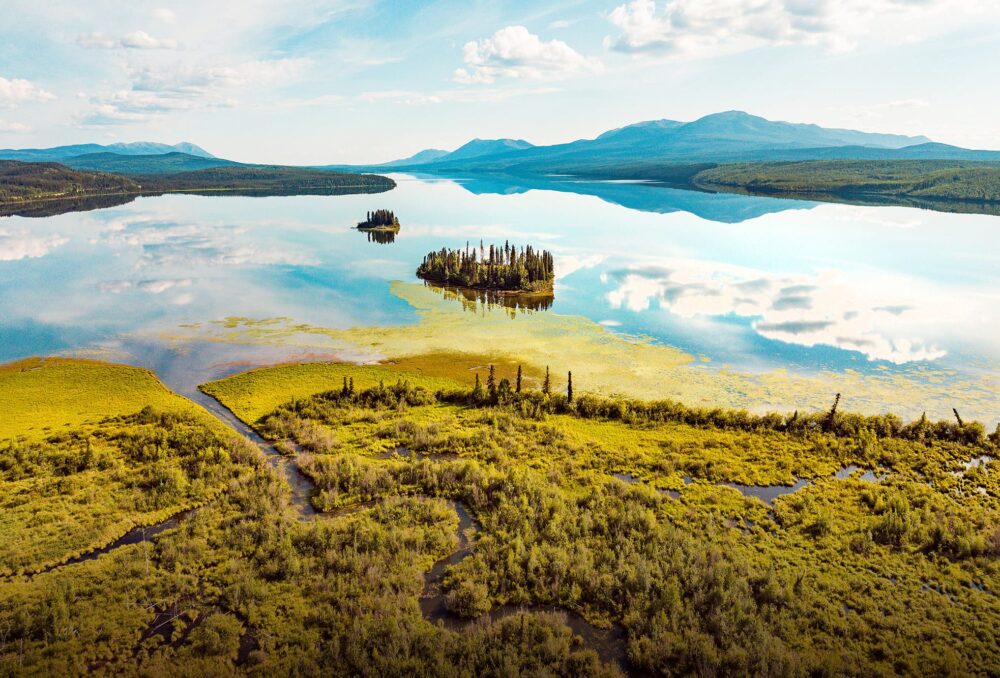
Canada’s boreal forest region is a massive area of land spanning 1.2 billion acres (486 million hectares) from British Columbia to Newfoundland and Labrador and across all three territories, encompassing 60 per cent of the national landscape within its ecozone. DUC has been mapping the region since 1997 and has recently marked the significant milestone of having mapped over 25 per cent of the Canadian boreal landscape.
The boreal is an important part of an ongoing national effort to support the development of a comprehensive Canadian Wetland Inventory. Much has changed since the inventory got underway in 1979. Until recently, large-area mapping was a hands-on and eye-straining affair, with staff classifying landscapes pixel by pixel using coarse-scale satellite images.
Moving from tedium to high-tech
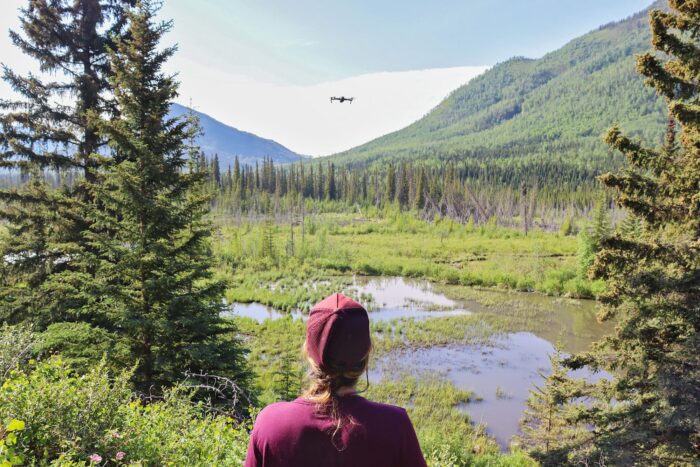
Advancements in technology have dramatically improved every aspect of mapping. In fact, the costs per kilometre of procuring and analyzing the data have come down by about 75 per cent, thanks to remote-sensing tools like drones and the processing power of machine-learning algorithms. This, combined with increased freely available data and reduced costs of data storage, have made scalability and repeatability of mapping a reality.
Spatiotemporal analysis (studying the changes over time) is particularly important for monitoring seasonal and temporary wetlands that form crucial habitat and for layering other data points that could help us understand the impacts of climate change on watersheds or how development may impact migratory paths, particularly in remote areas like the boreal forest. This brings us to another great advancement, which is the standardization of data and open-source tools which allows for important knowledge-sharing and conservation collaborations.
The importance of mapping wetlands
Wetlands provide a host of ecosystem services including flood, drought and wildfire mitigation, water filtration, carbon sequestration, wildlife habitat, and cultural and recreational benefits. Maps can help classify wetlands and convey data measurements of soil moisture, hydrodynamics, carbon density, nutrient levels and more. They can also help us to monitor ongoing conservation efforts, which is critically important when we consider that up to 70 per cent of wetlands have already been lost in southern Canada.
What gets measured, gets (sustainably) managed
Historically, the full suite of values that wetlands deliver has not been easy to calculate and therefore not considered when land-use planning decisions were being made — but there is change on the horizon.
Recently, Statistics Canada and Environment and Climate Change Canada partnered to develop the Census of Environment (CoE) in collaboration with Natural Resources Canada, Agriculture and Agri-food Canada and the Department of Fisheries and Oceans. Jim Brennan, DUC’s national director of industry and government relations, has been appointed to chair Statistics Canada’s National External Advisory Committee. The ambition of the CoE plan is to deliver Canada’s first-ever national registry of ecosystems, where the size and condition of ecosystems such as wetlands, coastal areas and urban forests will be tracked over time.
Cataloguing these ecosystems is a key step towards making evidence-based decisions to protect, rehabilitate, enhance and sustain our environment. A full understanding of the complex relationships between ecosystems and the economy, society and human health will support development of the necessary framework to help track Canada’s performance against goals and achieve a more sustainable future.
A map project that “had everything”
Jamie Kenyon, head of industry and government relations for DUC’s boreal operations in Northwest Territories and Yukon, was involved in the mapping of the 45,000-square-kilometre Dawson planning region from its inception in 2011 to its completion in 2021 and beyond.
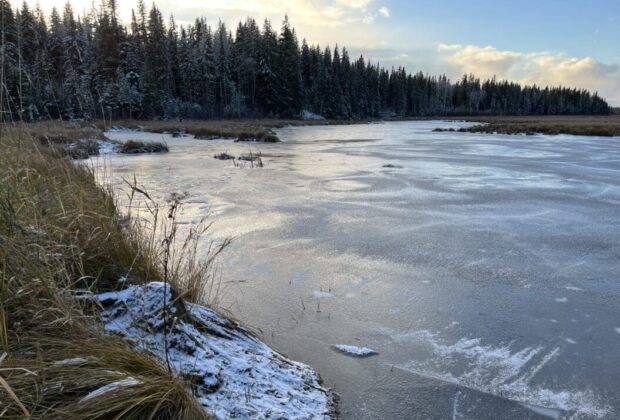
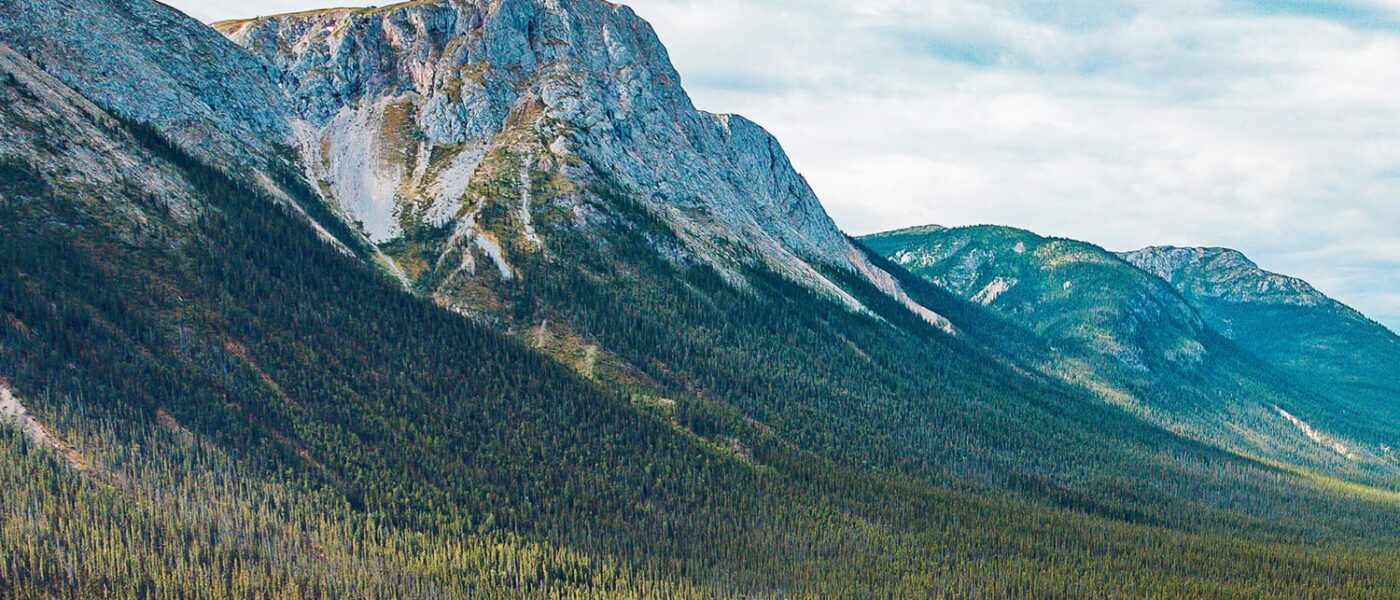
He recalls the challenges that came with mapping an unfamiliar terrain: the boreal and taiga cordillera. These ecoregions had features that altered the characteristics of water flow above and below the surface. For example, permafrost deep in the soil disrupted drainage and allowed wetland features to form in unexpected places.
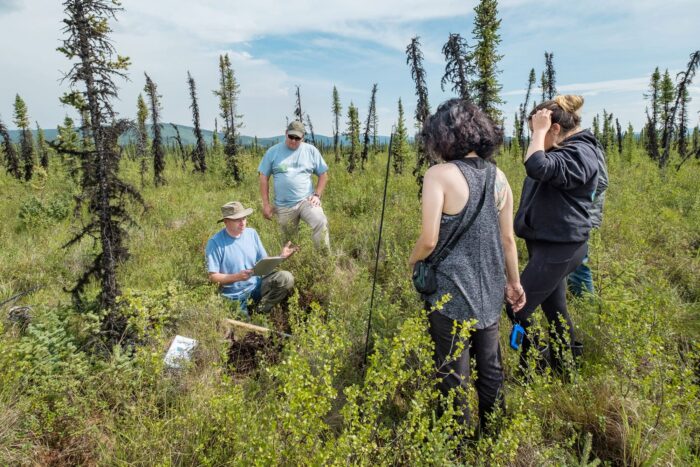
At one point we landed on a mountaintop, got out, dug a soil pit and the pit filled with water - and we knew yes, this is a wetland on top of a mountain. We saw fens on sloping mountainsides and filled our boots with cold water because we were experiencing these features for the first time. It was a learning experience; unexpected and fascinating.
Kenyon notes “this project had everything; a beautiful landscape, the chance to develop new wetland classification skills in a distinct region where DUC had not previously worked, the opportunity to test out new technology, and importantly, the opportunity to work closely with engaged and like-minded collaborators from Tr’ondëk Hwëch’in and Environment and Climate Change Canada.”
DUC delivered the completed maps in person in 2021 with an accompanying presentation to staff from Tr’ondëk Hwëch’in. Tr’ondëk Hwëch’in shared the data with the Dawson Land Use Planning Commission. Since then, a regional land use plan has moved through many stages, and the maps are being used maps are being used to inform local environmental impact assessments.
The DUC team shared their new learnings about wetlands and permafrost in a video series that was created to support understanding of the mapping process and value with local communities. Knowledge gained from the new ecozone mapping has already been applied in new mapping projects like the proposed Dene K’éh Kusan Indigenous Protected and Conservation Area in the Kaska region in northern B.C., and more opportunities abound.
Mapping 25 per cent of the boreal is more than a milestone. It’s proof that we can both expand our Canadian wetland knowledge and have a positive influence on these incredible landscapes, one map at a time. With advances in technology, we can accelerate the pace.
Ducks Unlimited Canada’s GIS mapping program is supported in part by the RBC Foundation through RBC Tech for Nature.
Wetland classes are in session
Wetlands are typically classified into one of five categories: bog, fen, swamp, marsh and shallow open water. DUC has developed an enhanced wetland classification system which further categorizes these five categories into 19 classification types. Learn more at ducks.ca/wetlands
DUC also offers Wetlands 101: An Introduction to Boreal Wetlands, a convenient, self-study online course for busy professionals. Participants will learn about boreal wetland types, how to classify them and explore practical examples to apply this information in their work. Learn more at boreal.ducks.ca
Explore the different types of wetlands
Canada’s wetlands are diverse; taking the form of marshes, bogs, fens, swamps and open water.
Learn more